5 Tableau Calculated Field Hacks
When we work with a specific software package a lot, shortcuts and certain tricks can equate to huge time savings.
Here are 5 of my favorite calculated field hacks that I use regularly:
1. List all calculated fields
Every so often I need to see a list of my calculated fields.
To do this, you can go to the Data pane in your side bar. Click on the little funnel icon right beside the search bar and choose Calculation. Alternatively, you can type C: in the search bar.
Show only calculated fields in your side bar Data pane
2. Find dependencies
Which sheets are using a calculated field? Good news, it is tracked and you can see it in the calculated field editor.
Check out which sheets use the current calculated field
3. Peek at the formula
In your calculated field editor, click the tiny gray arrow you see on the right-hand side of the editor. This opens the function reference, which shows the list of functions supported in Tableau. This is a great resource since this provides not only the syntax, but also description and examples.
Once the function reference is open, click on a calculated field you reference in the editor. You are now able to see the underlying formula.
A calculated field’s formula shows up in the Formula Reference area (right hand side)
4. Check out underlying formula
I tend to do this with Quick Table Calculations when I want to check what formula was used by Tableau. This trick can also be used can be done for other types of pills too (for example Dates).
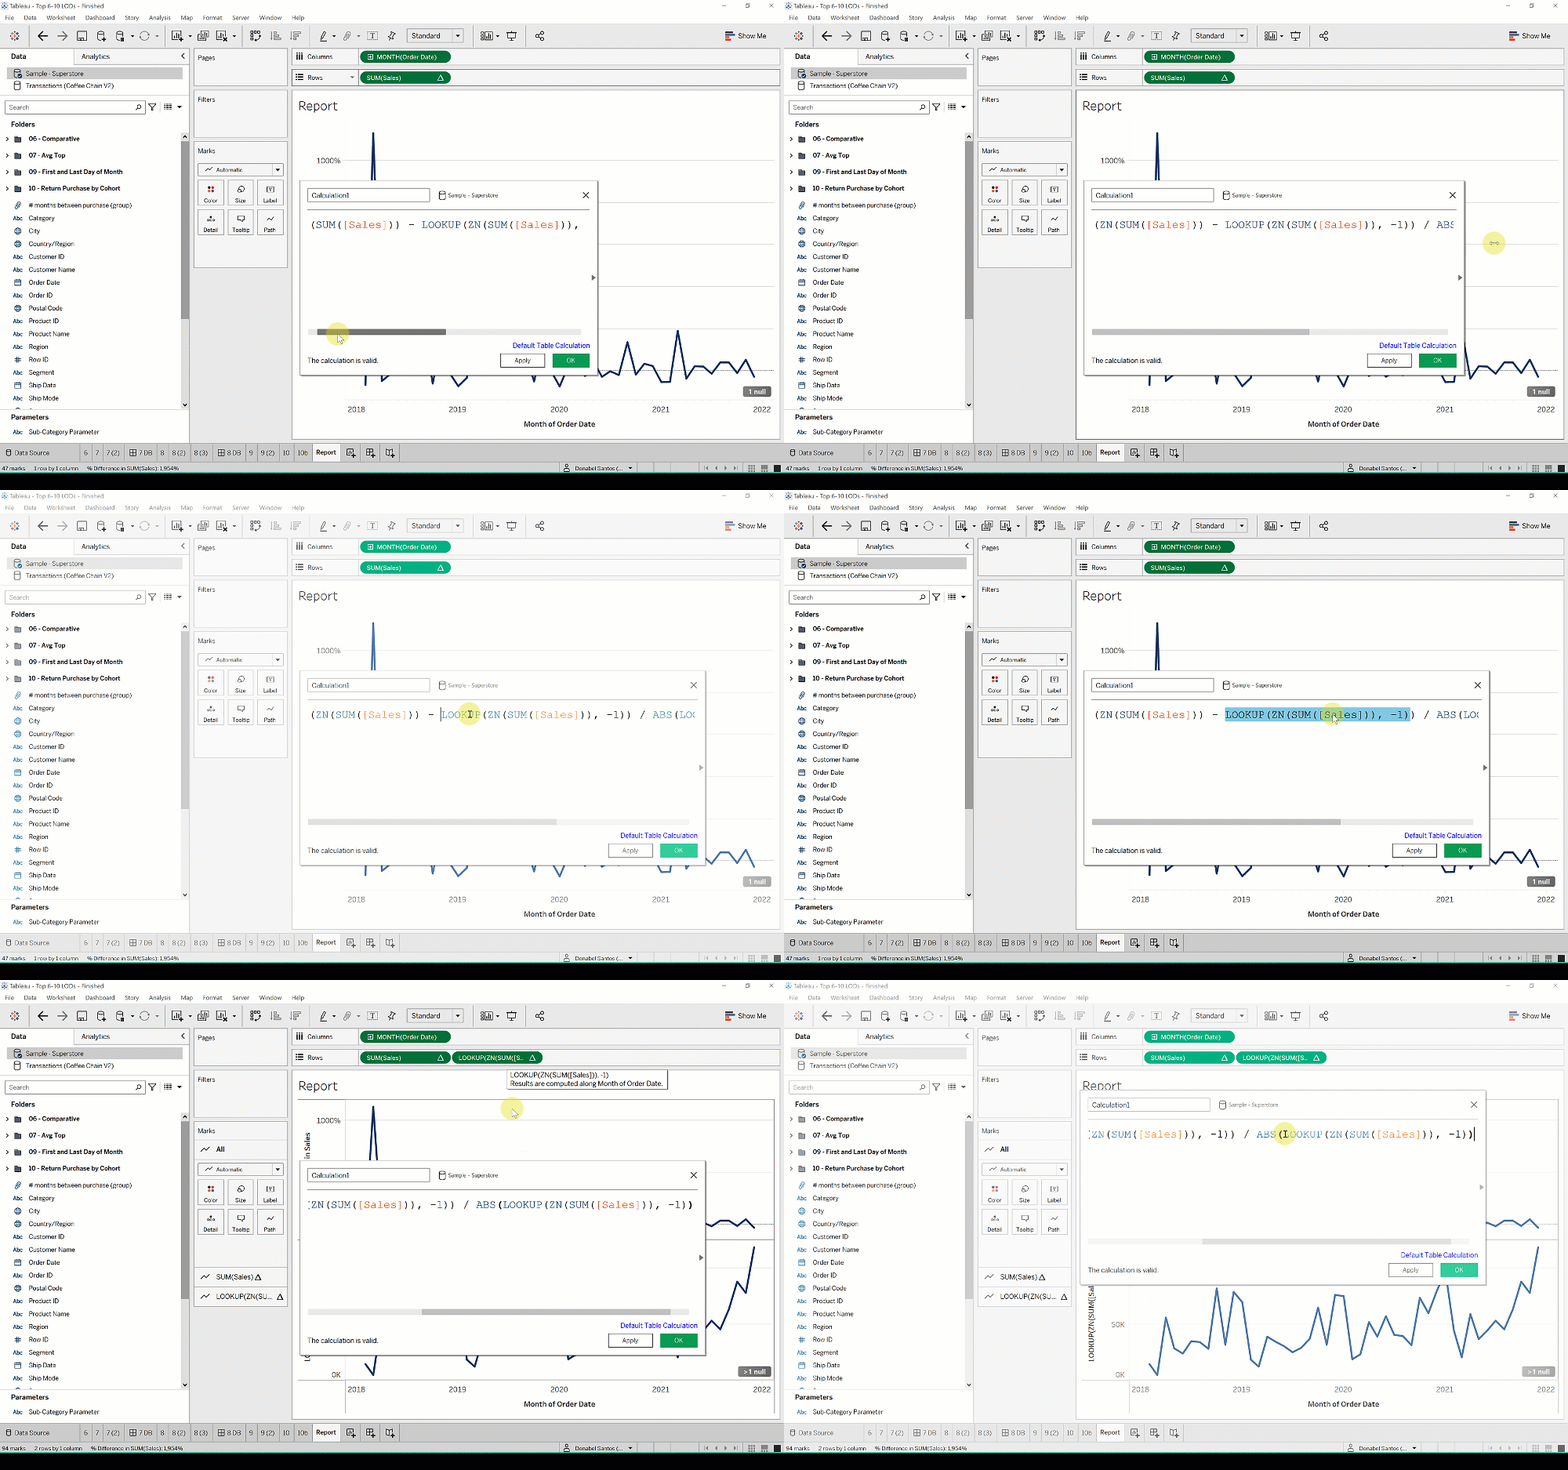
Simply drag your pill FROM Rows/Columns/Marks card to an open calculated field editor, and voila!
Drag pill from your shelf to an open calculated field editor to see underlying formula
5. Instantly visualize expressions
Conversely, you can highlight an expression in an open calculated field editor and drag it back to your canvas (Rows/Columns/Marks card) for an instant visualization.
Drag expressions from calculated field editor back to your shelf to visualize it
More tips
If you’re interested in additional tips when working with Tableau, you can check out the following video. This video covers additional tricks for text tables (labels, totals, aggregations), separating color legends for highlight tables, as well as working with dual axis charts.


